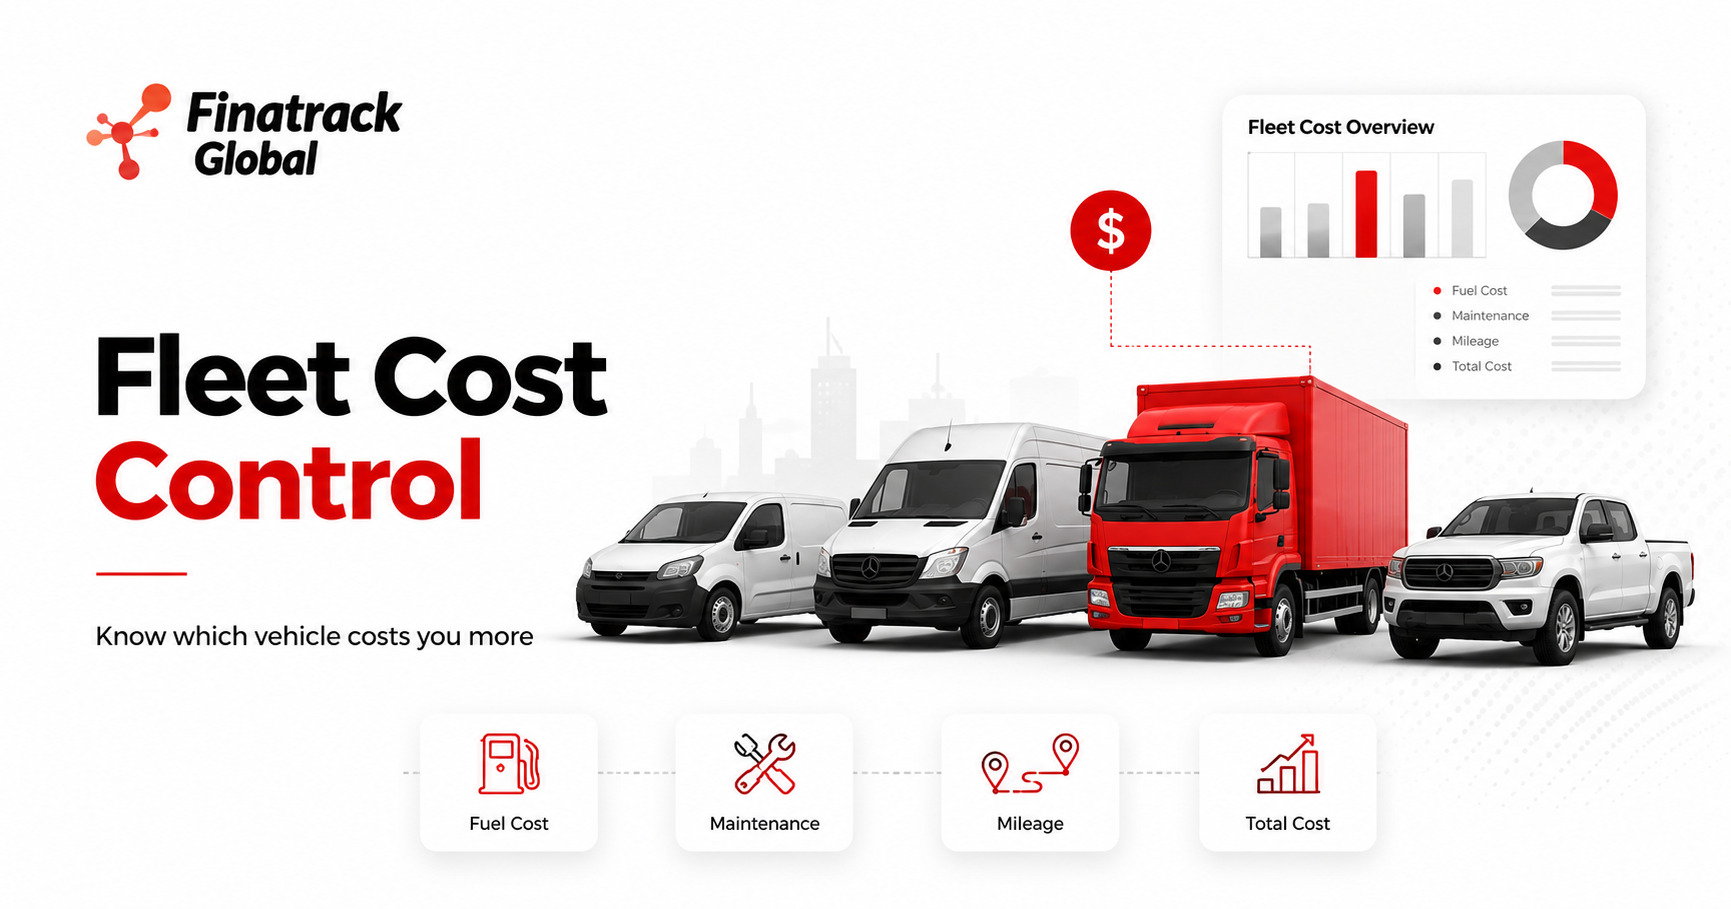
A fleet can become more expensive without management immediately understanding why. Fuel expenditure rises, vehicles visit the garage more frequently and drivers continue requesting money for repairs, tyres and servicing, yet the business still needs the same vehicles to keep operating. When all these expenses are combined into one monthly transport budget, it becomes difficult to identify which individual vehicle is responsible for the greatest financial pressure.
For Kenyan businesses operating several cars, vans, pickups or trucks, this is an important question because not every vehicle contributes equally to fleet costs. One vehicle may consume more fuel because it travels farther and generates significantly more revenue, while another covers relatively few productive kilometres but spends excessive time idling, breaking down or making unnecessary journeys. Looking only at the fuel bill can therefore give management the wrong impression about which vehicle is genuinely expensive.
The better approach is to examine each vehicle as an individual business asset. Mileage, fuel consumption, utilisation, idling, maintenance, downtime and the work completed should be reviewed together. GPS tracking and fleet telematics can provide much of the operational information required to make that comparison, while accounting and maintenance records provide the financial side of the picture.
Consider a business operating five delivery vehicles. Vehicle A consumes KES 70,000 worth of fuel during the month while Vehicle B consumes only KES 45,000. At first glance, management may assume that Vehicle A is the expensive vehicle and immediately begin questioning its driver.
Trip history may reveal a very different story. Vehicle A could have travelled twice the distance, completed far more deliveries and spent very little time stationary, while Vehicle B completed fewer assignments and accumulated substantial unnecessary idling. The vehicle with the higher fuel bill may actually be producing more value for every shilling spent.
This is why cost should always be connected to productivity. A truck costing the company KES 150,000 per month while generating substantial commercial activity can be more efficient than a smaller vehicle costing KES 90,000 while contributing very little productive work. Absolute expenditure alone does not tell management whether the asset is performing well.
Mileage provides one of the first pieces of useful context. Businesses should compare how far similar vehicles travel during the same period and determine whether those kilometres correspond with legitimate assignments. A high mileage vehicle may simply be carrying a larger workload, while unusually high mileage without equivalent business activity deserves closer examination.
Trip history helps explain where those kilometres came from. The business may discover repeated journeys back to the office, unnecessary detours, poor customer scheduling or personal use outside approved working hours. Every unnecessary kilometre contributes to fuel consumption, tyres, servicing and eventual depreciation.
A vehicle can therefore become expensive without developing a mechanical problem. Poor routing alone can gradually increase the cost of operating it. When inefficient journeys are repeated every working day, what appears to be a minor route issue becomes thousands of additional kilometres over the year.
GPS tracking gives management an opportunity to identify these patterns. Instead of simply asking why fuel expenditure is high, the fleet manager can examine where the vehicle travelled, how often it repeated the same route and whether another vehicle could have handled some assignments more efficiently. The conversation moves from suspicion to evidence.
Idling can create another hidden cost. A vehicle does not have to cover a kilometre to burn fuel, and commercial vehicles can spend significant periods stationary at warehouses, customer premises, project sites or traffic bottlenecks. If the engine remains running during these periods, fuel continues to be consumed while no additional transport work is completed.
A monthly comparison may reveal that one driver or vehicle spends far more time idling than comparable units. The cause should still be investigated because some stationary engine time may be legitimate. A delivery truck waiting to be loaded has a different operating reality from a sales car left running while an employee makes phone calls.
Location helps provide that context. If several vehicles show long stationary periods at the same warehouse, the problem may lie in the company’s loading process rather than with individual drivers. Fleet telematics can therefore expose operational inefficiencies that are quietly increasing vehicle costs.
Reducing these delays can create savings beyond fuel. Drivers become available sooner, vehicles complete more assignments and working hours are converted into productive activity rather than waiting. The business effectively obtains more capacity from the same assets.
Maintenance is another major cost that should be examined vehicle by vehicle. Two cars of the same age can generate very different workshop expenses because they operate under different conditions or receive different workloads. One may run mostly on highways while another operates on rough construction roads or through heavy urban traffic.
Management should therefore compare repairs, servicing and replacement parts against how the vehicle is actually used. A pickup requiring suspension repairs more frequently may spend most of its time on difficult project roads, while another similar unit travels almost exclusively on paved roads. The maintenance difference may be understandable rather than evidence that one vehicle is inherently unreliable.
Repeated repairs still deserve attention. If one vehicle returns to the garage every few weeks while comparable vehicles operate normally, the company should calculate whether continuing to repair that asset remains economical. The cheapest vehicle to keep on the balance sheet can sometimes become one of the most expensive vehicles to operate.
The cost of downtime should also be included. A delivery van sitting at the garage for four days does not only generate a repair invoice. The company may have to hire another vehicle, delay customer orders or redistribute work across an already busy fleet.
These indirect costs are easy to overlook because they may appear in different parts of the business accounts. The mechanic’s bill appears under maintenance while hired transport appears elsewhere, yet both resulted from the same unavailable vehicle. A meaningful fleet cost analysis should connect them.
GPS utilisation records can help identify how important the unavailable vehicle normally is to the business. A lightly used car being repaired for three days may create limited operational disruption, while a heavily utilised delivery vehicle can create immediate capacity problems. The real financial effect therefore depends on both the repair cost and the asset’s role.
Tyres represent another expense that can vary significantly between vehicles. Rough roads, aggressive driving, incorrect tyre pressure, heavy loads and high mileage can all contribute to faster wear. A truck replacing tyres more frequently than comparable units deserves investigation rather than simply accepting the expense as normal.
Driver behaviour data can provide part of the explanation where appropriate telematics is installed. Repeated harsh acceleration, braking or overspeeding may increase wear and accident exposure. The objective should not be to blame drivers automatically, but to identify patterns that can be improved through training.
Road conditions must still be considered. A driver working on construction sites or rural roads may naturally generate different vehicle behaviour from an employee travelling mainly on highways. Fleet comparisons are most useful when similar vehicles performing similar work are analysed together.
Fuel expenditure remains one of the most visible fleet costs, but it should be measured against distance and operating activity. A vehicle consuming 300 litres while travelling 4,000 kilometres presents a different situation from another consuming the same amount while travelling only 1,800 kilometres. The second vehicle deserves closer investigation.
Mechanical problems may contribute. Poor engine performance, tyre problems or other faults can increase fuel consumption even when the driver and routes remain unchanged. GPS tracking cannot diagnose these mechanical problems directly, but it can help management confirm whether mileage and journey patterns changed.
If fuel rises while routes, workload and mileage remain relatively stable, a mechanical inspection becomes more reasonable. If mileage also increased substantially, the fuel difference may simply reflect additional work. Telematics gives management the context needed before deciding where to investigate.
Dedicated fuel monitoring can provide deeper visibility for fuel-intensive commercial fleets. Depending on the vehicle and installation, fuel level data can be examined alongside location and vehicle activity. This may help businesses identify unusual refilling or fuel-level changes requiring investigation.
Fuel monitoring should still be interpreted carefully. Sensors, tank shape, vehicle movement and operating conditions can influence readings. The strongest conclusions come from combining fuel information with trip records, receipts and operational knowledge rather than relying on one reading alone.
After-hours usage can also make a vehicle disproportionately expensive. A company car may be used efficiently throughout the working day but accumulate substantial extra mileage during evenings or weekends. The business carries the maintenance and depreciation consequences even where the employee pays for some of the fuel.
Clear vehicle policies are necessary before evaluating such movement. Some companies allow employees to take vehicles home or permit limited personal use, while others prohibit it. GPS tracking should be used to verify whether usage follows the established policy rather than creating new rules after the journeys have already occurred.
Repeated unauthorised movement can add thousands of kilometres over time. Those kilometres accelerate servicing, tyre replacement and depreciation while increasing the period during which the company vehicle is exposed to road accidents. This makes after-hours use a genuine cost issue rather than merely an employee discipline issue.
Accidents are another factor that can make one vehicle unusually expensive. A car repeatedly involved in minor collisions can generate body repair costs, insurance claims and downtime even when mechanical maintenance remains reasonable. If the incidents relate to driving behaviour, telematics and driver coaching may help reduce future losses.
AI dashcams can provide additional context where more advanced safety monitoring is required. GPS may show where and when an event occurred, while video can help explain road conditions and driver actions. The combination can support more informed accident reviews.
Not every collision is caused by the company driver, so businesses should avoid simplistic conclusions. The purpose of analysing incident patterns is to identify controllable risk. If one driver repeatedly experiences incidents under similar circumstances, additional training or route changes may be justified.
Insurance expenditure should also be considered within the broader cost of owning the vehicle. Although premiums may not vary every month, they form part of the annual cost of keeping the asset available. Businesses that evaluate fleet profitability should include insurance alongside fuel, servicing and depreciation.
Tracking subscriptions and vehicle-security expenses should be treated similarly. GPS tracking is an operational cost, but it can also help reduce other expenses through better route control, utilisation and security. The value of the system therefore should be judged according to what management does with the data rather than treating it only as another annual fee.
Depreciation is one of the largest fleet costs even though businesses do not feel it every time the vehicle moves. A commercial vehicle gradually loses value as it ages and accumulates mileage. Excessive unnecessary use therefore consumes part of the vehicle’s resale value without necessarily creating additional revenue.
This becomes important when comparing vehicles. One company car may be relatively inexpensive to fuel but accumulating excessive mileage through poor scheduling. Another may consume more fuel but maintain a much stronger relationship between kilometres travelled and productive assignments.
Mileage should therefore be viewed as the consumption of an asset. Every kilometre should ideally contribute toward a legitimate business objective. When vehicles accumulate large numbers of nonproductive kilometres, the company is spending both fuel and future resale value.
The original purchase price also influences total fleet cost. A more expensive vehicle carries more capital investment, while financing can add interest or other funding expenses. Businesses comparing vehicles should therefore distinguish between day-to-day operating cost and total cost of ownership.
A fully paid older vehicle may appear cheap because there is no monthly loan instalment, yet frequent repairs and downtime can make it commercially expensive. A newer financed vehicle may carry a higher fixed monthly payment while producing far fewer breakdowns. Management needs to examine the total picture.
This is why a cost per kilometre or cost per productive assignment can become useful. Instead of looking only at how much each vehicle spent during the month, the company can relate those costs to actual work completed. The calculation does not need to become unnecessarily complicated to reveal meaningful differences.
For example, the business can combine fuel, routine maintenance and other major operating expenses and compare them with mileage. For delivery fleets, costs can also be considered against deliveries completed, while field service companies can compare them with customer jobs. The metric should reflect how the vehicle creates value.
A high cost per kilometre can highlight vehicles requiring investigation, but it should not be interpreted automatically. A heavy truck will naturally cost more per kilometre than a small sales car, while a vehicle operating on rough roads may carry higher costs than one travelling on highways. Similar vehicle categories provide more useful comparisons.
Vehicle utilisation is equally important. A company may own a car that creates relatively little fuel expense simply because it barely moves. That does not necessarily make it economical because insurance, depreciation and other fixed costs continue while the asset remains parked.
An underused vehicle can therefore be one of the fleet’s hidden expenses. The business pays to own it but receives little productive value in return. Before expanding the fleet, management should always understand whether existing vehicles are being used sufficiently.
GPS tracking can reveal these underused units. A monthly utilisation review may show that one vehicle travels almost every working day while another moves only a handful of times. Management can then investigate whether the lightly used unit should be reassigned, pooled or eventually sold.
The opposite problem is an overworked vehicle. One pickup may handle most assignments while other similar assets remain lightly used. The heavily utilised vehicle accumulates mileage and maintenance much faster, making it appear expensive when the real issue is workload imbalance.
Reallocating work can reduce this pressure. The goal is not to force every vehicle to travel exactly the same distance but to ensure that the workload distribution makes operational sense. Better allocation can improve maintenance planning and extend useful asset life.
Branches can create particularly large differences. A company may have one location where vehicles are heavily used and another where suitable units remain parked. Looking at fleet cost only at company level hides this imbalance.
Central tracking allows management to compare branches. If one location repeatedly hires additional transport while another has underused vehicles, transferring assets could reduce expenditure without buying another car. GPS data makes the opportunity easier to identify.
Route efficiency should also be considered as part of vehicle cost. Two drivers may complete the same number of customer visits but cover significantly different distances. The employee travelling farther may operate in a larger territory, but poor route planning could also be responsible.
Historical GPS data reveals repeated backtracking and unnecessary detours. Customers within the same geographical area may be visited on different days or in an inefficient sequence. Reorganising appointments can reduce kilometres without reducing customer service.
For field service businesses, dispatching the nearest appropriate vehicle can create similar savings. Sending a technician from Mombasa Road to Westlands makes little sense if another qualified technician has just completed a job nearby. Real-time fleet visibility helps management use the resources already on the road.
This reduces both travel time and vehicle cost. The company completes more productive work while reducing nonproductive kilometres. The same principle applies to delivery, recovery, sales and inspection fleets.
Driver time should also be treated as part of the fleet cost. A company may focus on fuel and maintenance while overlooking the employee hours lost to unnecessary travel. A salesperson spending four hours driving inefficiently has four fewer hours available for customer engagement.
GPS route information can therefore reveal a cost that does not appear on the fuel receipt. The business is paying salary while productive work is being displaced by road time. Better scheduling can improve the return from both the employee and the vehicle.
Waiting time at customer locations creates another hidden expense. A delivery truck may spend ninety minutes waiting to unload, while the driver and vehicle remain unavailable for other assignments. If this happens repeatedly, the commercial cost can become substantial.
Trip and stop information can identify customers or locations where these delays occur. Management can then investigate whether delivery windows, procedures or pricing should change. A customer who consistently consumes excessive transport time may be less profitable than their sales revenue suggests.
This is where fleet data begins supporting wider business decisions. Tracking is no longer simply telling management where a vehicle is; it is helping identify how individual customers, routes and operating processes affect costs. Better vehicle visibility can therefore improve commercial decision-making beyond transport itself.
A monthly fleet cost review can begin by grouping information for each vehicle. Management can examine mileage, trips, fuel, idle time, after-hours use, maintenance expenses, downtime and significant driver events. The goal is to identify exceptions rather than produce an enormous report.
Vehicles with normal operating patterns do not require constant investigation. Attention should focus on those showing unusually high cost, unusually low productivity or a sudden change from previous months. Exception-based management keeps fleet analysis practical.
Trends are often more useful than one month in isolation. A vehicle may experience an expensive repair this month but perform reliably for the rest of the year. Another unit may generate modest but persistent excess costs every single month.
The second vehicle can ultimately cost the business more. Comparing several months prevents management from overreacting to one unusual invoice while ignoring repeated inefficiency. Reliable GPS history helps build this longer-term view.
Seasonal changes should also be considered. A distribution fleet may operate more intensively during particular periods, while field teams may travel more during certain projects. Increased expenditure can be completely reasonable if business activity also increases.
The key question is whether costs are rising faster than productive fleet activity. If fuel and maintenance rise by 30 percent while deliveries increase by a similar amount, the result may be understandable. If costs rise dramatically while workload remains unchanged, management has a stronger reason to investigate.
Tracker health must also be checked before relying on the analysis. A vehicle showing unusually low mileage may simply have had an offline tracking device. Missing data can make an active vehicle appear underused.
Fleet managers should therefore review last update times regularly. Devices that stop communicating should be investigated before their data is used for serious operational decisions. Reliable fleet management depends on reliable information.
Trackers should also be checked after workshop repairs and battery replacement. Electrical work can accidentally disturb GPS wiring while the vehicle itself continues operating normally. The resulting missing trips can distort mileage and utilisation reports.
Subscription status matters for the same reason. An expired tracking service can leave a physical device installed in the vehicle while new movement information stops reaching the platform. Fleet administrators should maintain renewal dates as part of their normal vehicle records.
Data quality also depends on correct vehicle identification. If a GPS tracker is transferred to another car but the tracking platform still displays the previous registration, reports can become attached to the wrong asset. Accurate fleet administration is therefore essential.
Once reliable data is available, management can begin ranking vehicles according to the factors that matter to the business. One organisation may prioritise fuel and maintenance, while another may be more concerned with vehicle utilisation and downtime. There is no single cost metric that suits every fleet.
The strongest analysis connects expenditure to business output. Management should ask not only “Which vehicle costs us the most?” but also “What are we receiving in return for that cost?” A hardworking truck should not be punished for costing more simply because it generates more productive activity.
The vehicle that deserves attention is often the one consuming significant resources without producing equivalent value. That could be an underused executive car, an unreliable delivery van, a poorly routed sales vehicle or a truck spending too much time idling. GPS tracking helps identify the operating behaviour, while financial records establish the cost.
After identifying the expensive vehicle, management still needs to determine the right action. Driver coaching may solve some problems, while route changes, mechanical repairs or reassignment may solve others. In some cases, selling or replacing the vehicle may eventually be the most economical option.
The solution should address the reason for the cost rather than the symptom. Replacing a vehicle will not fix poor dispatching, while coaching a driver will not repair a mechanically inefficient engine. Good fleet management starts by correctly diagnosing the source of the expense.
Businesses should measure results after changes are made. If idling is reduced, management can compare fuel and operating patterns over the following month. If routes are reorganised, mileage and customer service performance can be reviewed again.
This creates a continuous improvement process. The company identifies an abnormal cost, makes a practical change and then checks whether the numbers improve. Fleet telematics becomes valuable because it provides the evidence needed before and after the decision.
Smaller businesses do not need complicated analytics to benefit from this approach. Even a company operating five vehicles can compare monthly mileage, fuel, repairs and trip patterns. Large differences often become obvious once the information is placed side by side.
Larger fleets can perform comparisons by vehicle type, branch or department. Trucks should generally be compared with similar trucks, while sales cars should be reviewed against vehicles performing comparable work. This makes the analysis fairer and more meaningful.
The ultimate objective is not simply reducing fleet expenditure at any cost. Vehicles exist because they enable deliveries, customer visits, field service, logistics and other activities that generate value for the organisation. Cutting fleet costs in a way that damages those operations would be counterproductive.
The goal is therefore better cost efficiency. Every litre of fuel, kilometre travelled and maintenance shilling should contribute as effectively as possible toward business activity. GPS tracking gives management a clearer view of where that efficiency is being achieved and where money may be leaking away.
Finatrack Global Ltd provides professionally installed GPS tracking and fleet telematics solutions for Kenyan businesses seeking better visibility over vehicle movement and operating activity. Depending on the tracking solution, businesses can review location, trip history, mileage, idling, selected driver behaviour information and other fleet data that can support more informed cost management.
Professional installation can be arranged at the customer’s convenient location or through Finatrack Global Ltd at Vision Plaza, 1st Floor, Office 2, Mombasa Road, Nairobi. Businesses looking to understand where fleet costs are coming from can contact 0723 645 810 or visit www.finatrack.co.ke to discuss an appropriate tracking and fleet management solution.
Rising fleet costs should not be treated as one large unexplained number at the end of the month. Every vehicle has its own routes, drivers, workload, fuel consumption, maintenance history and utilisation pattern. Once management starts examining those vehicles individually, the question changes from simply asking why the fleet is expensive to identifying exactly which asset, behaviour or process is consuming money and what can be done about it.